

America’s natural disasters are growing bigger and more frequent. In the last five years, we saw Hurricanes Ida, Ian, and Helene; the Maui fires; and the catastrophic Kentucky floods. Each event upended tens of thousands of lives, and each one left a measurable trail in local real estate markets. Until recently, that trail took years to surface in traditional demographic data. Now, with migration data from CENSAI analytics, we can watch it unfold quarter by quarter, zip code by zip code, in near real time.
Analysis: How CENSAI tracks climate risk in local real estate markets
CENSAI’s quarterly migration feed covers every U.S. zip code going back to 2018. When you pair it with FEMA’s public records of major disaster declarations, you can see precisely which neighborhoods experienced population loss in the year after a catastrophic event — and which neighborhoods held steady.
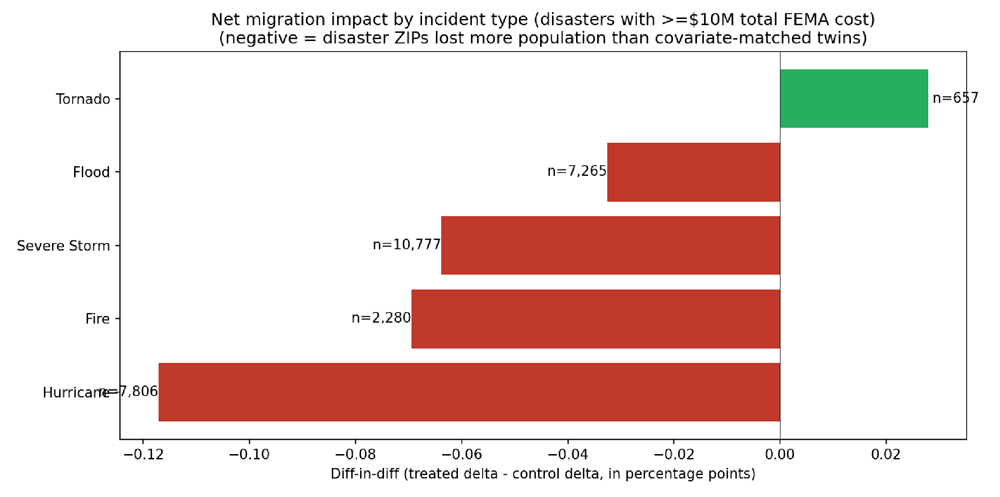
Our analysis looked at the 183 federally declared disasters since 2020, which cost the government at least $10 million in combined household aid and public infrastructure spending across five major incident types: hurricane, wildfire, flood, tornado, and severe storm.
The central challenge was separating a disaster’s effect from the usual ebb and flow of population, or shifting neighborhoods due to COVID’s sunbelt flows, Rust Belt decline, and urban-to-suburban reassortment. For each zip code hit by a major disaster, we built a control group consisting of look-alikes: 30 demographically similar zip codes in the same state or a bordering state, matched on pre-event migration trend, population tier (rural, suburban, or urban), home value, and household income. Then we compared how the disaster-affected zip codes moved during the year after the event, relative to their look-alikes.
Results: Measurable population declines
The signal was clear and consistent. Over the year, disaster-affected zip codes showed population losses compared to their look-alikes.
| Zip codes affected by | Population loss |
|---|---|
| Hurricanes | –0.12 pp |
| Wildfires | –0.07 pp |
| Severe storms | –0.06 pp |
| Floods | –0.03 pp |
Individually, these are modest numbers. But when compounded across Hurricane Ian’s Florida footprint, which includes hundreds of thousands of residents, they amount to thousands of net migrants who would otherwise have stayed. And because Florida is already losing population on net at the state level, the disaster-driven migration piles on top of a broader climate-driven reshuffling already underway.
The timing value of CENSAI’s population intelligence
For real estate professionals, these patterns matter because they surface before insurance repricings, REIT revaluations, and traditional demographic releases. A developer considering a coastal project, a lender pricing a multiyear mortgage, or a municipal official forecasting school enrollment can now watch, in near real time, whether a neighborhood is recovering or quietly depopulating.
CENSAI’s migration data doesn’t predict where the next disaster will strike, but it tells you faster than any other source how the last one is reshaping local housing demand. In a world where climate risk is steadily rewriting the map of where Americans live, that timing advantage is where the signal lives.
Explore the unrivaled granularity of CENSAI’s migration insights with a free 7-day trial.